AES Preprint 4364 (J-4)
TriSonic Info
A method of providing stereophonic imaging for a large listening area is presented. This method, in its basic form, utilizes three loudspeakers to present a two-channel stereo program source. It overcomes some of the basic problems of two-loudspeaker stereo imaging through the use of a linear matrix optimized for maximum electrical separation and optimum placement and acoustic interaction of the loudspeakers. A listening experiment is conducted to show how the optimum-matrix system compares with conventional stereo imaging when using an amplitude pan control for sound source placement.
0 INTRODUCTION
The idea of using more loudspeakers than program channels has been proposed in many forms. In 1958 Klipsch described methods of adding a center loudspeaker [1], [2], driven with either the sum or difference of the left and right program signals, to allow a wider soundstage with two-channel program material. Scheiber's 1973 patent [3] described a four-channel playback system which used a matrix concept to derive four playback signals from two program signals for surround sound. In 1977, Lackey, et al. [4] presented a matrix system which used three loudspeakers to present a soundstage with depth. More recently Gerzon [5] has described a family of energy-preserving matrices for utilizing more loudspeakers than program channels.
All of these systems have the same general goal of improving stereophonic imaging economically by using existing program material or conventional recording and transmission technology. However none have come into common use because the improvement afforded is relatively small compared to the burden of adding an additional loudspeaker and amplifier. Furthermore, the benefits are primarily for listeners in or near the center of the listening area, limiting the value of the improvement.
The matrix approach described here is shown to enlarge the listening area in which good stereophonic imaging can be perceived. This allows many people to simultaneously enjoy stereo imaging from the same system, in the same room. This matrix approach is optimized differently from those described previously. The electronic matrix circuit allows maximum amplitude separation between the output channels, and the suggested physical configuration takes advantage of the matrix characteristics.
This system is intended primarily for enhancing the soundstage created when sounds are spread between two channels using amplitude panning. This encompasses the vast majority of existing program sources and recording techniques. The basic concept is to use a loudspeaker to reproduce the central image location between any pair of loudspeakers which have adjacent program-channel assignments. The system concept allows the user to adjust the system for optimum performance by listening.
This system comprises two important components: an electronic matrix circuit and correct loudspeaker placement. The electronic matrix circuit derives three output signals from two input signals. This is achieved using the following matrix process:
Lo = Li - MxRi
Co = (1-M)x(Li+Ri)
Ro = Ri - MxLi
Where
Li = the left input signal,
Ri = the right input signal,
M = the matrix factor,
Lo = the left output signal,
Co = the center output signal, and
Ro = the right output signal.
The three output signals are used to drive three loudspeakers, which are placed in a symmetrical array with the center loudspeaker equidistant from the side loudspeakers.
The matrix factor M is generally set at 0.5 which maximizes the amplitude separation between the signals at 6 dB. Lackey, et al. [4] formally proved that this is the maximum possible separation between three channels derived from two.
In practical implementation, M is a variable which can be set automatically according to the stereo signal or manually by the listener. This allows compensation for different program material to provide optimum imaging. The matrix concept is shown in Figure 1.
The 6 dB of electrical channel separation can be effectively and subjectively increased further due to the principle of acoustic vector-sum imaging as described by B. Bauer [6]. This principle is further explained by Gerzon [5] in terms of the velocity theory in which velocity and pressure vectors are used, and the energy-vector theory, in which the intensity vector and total energy are used.
For this type of localization to be most effective, the three speakers need to be identical, and placed at the same height and in a slightly curved array. This provides a degree of time and amplitude alignment for most listeners, allowing each loudspeaker to cover as much of the listening area as possible with relatively even sound level distribution. However in practice this system has a high tolerance for deviations from the ideal arrangement.
Vector addition of the sound pressure from the three loudspeakers will provide a resultant sound pressure which represents the source direction based on the relative signal amplitude in the original channels. This occurs primarily at mid and low frequencies, where the wavelengths are long enough for acoustic vector addition to be perceivable.
Figure 2 illustrates the effect of acoustic vector addition in a particular case where a single signal is panned fully to the left. In this example, M has a value of 0.5. The left speaker reproduces the left signal at full strength. The center speaker, with its attenuation factor of 0.5, pulls the apparent source location toward the center. The right speaker, with its coefficient of -0.5, will acoustically "push" the apparent sound source location back to the left again. This is illustrated in the diagram as a vector sum of three components. In this case the resultant is actually pushed a bit further to the left than the left speaker. If the loudspeakers are well-matched and the room acoustics are good, which generally means the area around and behind the speakers is as acoustically dead as possible, then the soundstage can be widened beyond the left and right loudspeakers.
For center-panned signals, the center output will always be 6 dB higher than the side outputs, regardless of the M value. The retention of this optimum separation level with any value of M is an inherent advantage of this approach. Thus, even if the central image area is attenuated through the use of a high M value for soundstage widening, the ability of the system to create well-focused center imaging is never compromised.
It is interesting to note how the left-center and right-center intermediate pan locations are reproduced in this system with phantom images between the respective adjacent loudspeakers. For example, if a signal is panned so that the left program channel is 6 dB higher in level than the right program channel, then the matrix will completely cancel that signal in the right loudspeaker. Meanwhile, the left and center loudspeakers will reproduce that signal at exactly equal levels, resulting in a phantom image midway between the left and center loudspeakers, correctly representing the left-center pan location. The right-center pan location is reproduced similarly.
The matrix is adjustable to allow optimum sound distribution to the three outputs. As the matrix factor M is varied, the relative level between the side speakers and center speaker will change. When M is adjusted so that the three speakers sound at the same level, the matrix factor will be optimized, and the separation maximized for that program source.
Adjustment of the matrix factor for optimum sound with typical program sources usually results in a value in the range of 0.5 to 0.8. The variation is due largely to the way the program is mixed or transmitted. Many sources, particularly broadcast signals, have a high signal correlation between the two channels, which results in a narrow stereo image. Such program material can be restored to full image width with a matrix factor higher than 0.5, which will attenuate the correlated signal components of the two channels relative to the uncorrelated signal components.
A basic application of this system is stereo sound reproduction of conventional program material using three loudspeakers instead of two. The primary result is improved imaging performance when a listener is off center from the left and right loudspeakers.
Where more than two program channels are available, the system can be applied to adjacent channel pairs with equivalent results. For example if three discrete channels are available, such as left, center, and right, then left-center and right-center loudspeakers can be added and the matrix applied twice to derive the appropriate signals for each of the five loudspeakers, as shown in Figure 3. The improved imaging performance for off-center listeners will then be available to the discrete multichannel system. In effect, the three-discrete-channel system with five loudspeakers will sound more like a five-discrete-channel system, providing a significant improvement in image focus and clarity.
The optimum matrix concept can also be applied to a discrete four-channel surround sound system for sound reproduction with eight loudspeakers, as shown in Figure 4. In this case there are four contiguous sound stages, each with a center loudspeaker added to clarify and anchor what was the phantom-center imaging area between each adjacent pair of loudspeakers.
Another application creates a vertical sound image suitable for cinema or projection-video applications, as shown in Figure 5. In this case nine loudspeakers are used to reproduce four discrete program channels. The optimum matrix is applied between adjacent channel pairs, creating four new in-between loudspeaker signals. Then it is reapplied to the new signals to create horizontal and vertical crossing arrays with the center loudspeaker. With this arrangement, sounds can be clearly placed at any of the nine loudspeakers, and sounds can be effectively placed between them, with appropriate panning between the four program channels.
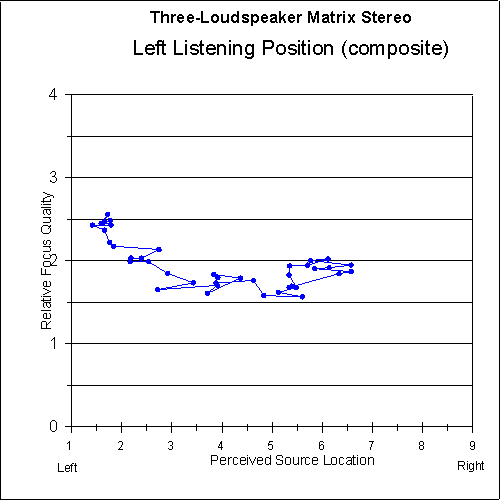
An experiment was conducted to compare the imaging performance of the three-loudspeaker matrix system with a conventional two-loudspeaker system. This experiment has produced data which describes these systems in three ways. First, for each system, the location of a sound was determined based on the signal-amplitude ratio resulting from amplitude-pan positioning of a sound in the stereo image. Thus, the two systems can be compared for imaging linearity and compatibility. Second, both center and off-center listening positions were compared. The results indicate the relative effectiveness of each type of system for covering a large listening area. Finally, the focus quality of each perceived sound-source location was judged. This provides a comparison of the ability of each type of system to create a clear, precise sound image at various locations across the soundstage.
In this experiment, listeners were presented with a recorded series of 40 sounds. They were asked to judge the apparent sound-source location and the focus quality of each sound. Each of eight listeners heard the recording four times to evaluate two different systems at two listening locations. Three of the listeners also heard the recording from a third listening position. A total of 1520 sound-source location and 1520 focus quality judgements were made.
The listeners were given no technical information regarding the sound systems. They were required to remain in the seat location, but were advised that it is often helpful to move one's head and to look at the supposed source location which is to be identified. They were told that horizontal placement was to be evaluated, and vertical or distance effects ignored.
The equipment was completely covered with a curtain to prevent undesired visual influence. Tags numbered from 1 through 9, with 5 in the center, were attached to the curtain in a horizontal array for the listener to use as a guide in determining each sound-source direction.
One system was the matrix imaging system with three loudspeakers. The matrix factor was precisely set at 0.5. The other system was a conventional arrangement which used only the left and right speakers directly driven with the left and right recorded channels.
For each sound sample, system, and listener location, the eight listener responses were averaged together. The resulting data was plotted graphically to demonstrate the imaging performance of each combination.
Sound Sample Recording
The sound samples consisted of a variety of styles of music taken from commercially-made compact discs. Some of the samples featured specific instruments such as drums, brass, clarinet, violin, voice, etc., while other samples included more complex mixes such as a symphony orchestra, rock bands, and jazz bands. All samples originated in stereo but were mixed to a monophonic signal for panning.
Each monophonic signal was amplitude-panned at a specific ratio and recorded in stereo. For each sound, the recording included a sound-number announcement and then about eight seconds of the sound. The 40 sounds included 35 possible pan ratios. The sequence of pan ratios was random.
For the purpose of channel balance calibration, the recording also included a sound sample with left and right channels set at identical levels, but the right channel was inverted. By adjusting the left-right balance during playback for a complete null in the center loudspeaker (which presents a precise left-right sum), exact channel balance is achieved.
To make the recording, a special precision active pan device was built. This consists of a seventeen-position rotary switch and three toggle switches. The rotary switch provides left-right level differences of -0.5, -1.0, -1.5, -2.0, -2.5, -3.0, -3.5, -4.0, -5.0, -6.0, -7.0, -8.0, -10.0, -12.0, -15.0, and -20.0 decibels, and an "off" position for hard panning. One of the toggle switches provides a center pan position with a level difference of 0 dB. Another switch allows selection of panning to the right or left by simply interchanging the left and right outputs. The third switch provides precise polarity inversion of the more attenuated output and in this experiment was used only for the calibration signal. All of the switch positions were precisely calibrated to within 0.1 dB with individual trimmer potentiometers. The pan law follows a constant-power concept using a circuit essentially similar to that described by Orban [7].
Room and Speaker Layout
The experimental setup is shown in Figure 6. The room is about 3.5 m by 7.3 m, and the left and right loudspeakers were 2.4 m apart. The center loudspeaker is set back 0.25 m. The left and right loudspeakers are angled inward at 20, as intended by design. The center listening position is 3 m from the front of the center loudspeaker. The off-center listening positions are 1.2 m to each side of center, lined up directly with the right and left loudspeakers. A curtain is placed in front of the loudspeakers, with numbered tags on it spaced apart by 35.6 cm.
The room has carpeted walls and floor, and the ceiling is covered with acoustic tile. The result is a room similar to a home listening environment but with weaker reflections so that direct-sound localization can occur with minimum interference. Two sound-absorber panels, each 1.1 m by 1.6 m, were placed behind the listeners to reduce any possible reflections from the back wall.
Listener Judgement Data
The listeners judged the sound-source location of each recorded sound using the numbered tags. Whenever a sound source seemed to be located between two numbers, a fractional designation was used, such as 3.5, 6.8, etc.
Then the listener judged the focus quality of the sound. This is a determination of the apparent size of the sound source and the listener's relative ability to localize it. A small sound source is considered to be good focus quality; a large sound source is considered to be poor focus quality. The grading scale was stipulated as follows:
A Excellent focus and pinpoint localization
B Particularly good focus and clear localization
C Moderate focus and average localization
D Somewhat poor focus and slightly difficult localization
E Poor focus and difficult localization
The instruction was that these judgements are relative and the average grade for the whole experiment was to be approximately C. If the listener could localize the sound but was unsure about the focus quality, then a grade of C was to be given.
Since the listener is not asked to make any judgement concerning whether a system is good or bad, preference bias is unlikely. The listeners had no way of knowing the recorded pan ratio, or what apparent sound source location should occur.
The focus quality judgements made by each listener are linearly shifted so that all of their grades exactly average C. This compensates for any overall grading bias of each listener. The listeners also did not know the location of the loudspeakers, so there could not be a preference for one part of the soundstage over another. The left loudspeaker was placed between 1 and 2; the right loudspeaker was placed between 8 and 9.
In comparing one system to the other there is a theoretical possibility of bias. Some of the listeners were casually familiar with the matrix sound system and theoretically could have been able to identify it while listening. However, there was no indication that any listener knew which type of sound system they were hearing.
The results were processed numerically and graphed for analysis. For a given listener position, system, and sound sample, the sound-source location data was averaged across all listeners. The location data was then corrected for parallax error due to the curtain and number tags being about 0.4 m in front of the actual sound image created by the loudspeakers. Since the physical setup had the left loudspeaker placed at location 1.57 and the right loudspeaker placed at 8.43, the location data was scaled so that the image width would be represented graphically with the left loudspeaker at 1 and the right loudspeaker at 9. Data from the left and right listening positions were compared and found to have good symmetry, so the right data was mirrored and averaged with the left to create composite off-center data for graphing. The perceived sound-source location is plotted versus the amplitude ratio created by panning in the recording. In all of these plots, the designations "left" and "right" are used on the Relative Channel Level axis to indicate hard panning where the signal appears only on one channel.
All of the focus-quality data was converted to a numerical scale where A=4, B=3, C=2, D=1, and E=0. Each listener's data was averaged to determine an overall correction value for that particular listener. This correction value was then added to each individual judgement; the result is that each listener has a total average focus-quality rating of 2.0. Then, for each listener position, system, and sound sample, the focus-quality judgements were averaged across all listeners, and plotted versus the actual perceived sound-source location. This created a very ragged plot, so a moving average of five data points was applied to smooth the resulting curves, so that the general trends could be seen.
Figures 7 and 8 are plots of perceived sound-source location versus relative channel level (pan ratio) for two-loudspeaker stereo and three-loudspeaker matrix stereo, as perceived from the center listening position. In comparing the two systems, one can see that the results are very similar. The image linearity across the soundstage of the matrix system closely matches that of conventional stereo, indicating that program material mixed using two loudspeakers can be accurately reproduced with the matrix system. Note that for both systems, a channel level ratio of 4 dB in each direction represents approximately the central third of the imaging area, i.e. locations ranging from about 3.7 to 6.3.
Figures 9 and 10 show the focus-quality judgements of the listeners versus the perceived sound-source location for each system. As can be seen in the graphs, the focus quality for the two-loudspeaker system is very good at the extreme left and right (as would be expected), but there is a dip in the central image area where the focus quality is somewhat below average. The focus quality for the matrix system is above average all the way across the image area.
Figures 11 and 12 are plots of the perceived sound-source location versus relative channel level for the two-loudspeaker system and the three-loudspeaker matrix system, as perceived from the left listening position. In the case of the two-loudspeaker system, center-panned sounds are pulled almost all the way to the left, from location 5 for a central listener, to about 1.6 for a left-positioned listener. The matrix system recreates center-panned sounds at about location 4 for the left-positioned listener, a much smaller shift from the intended location.
Consider also in Figures 11 and 12 the intended central third of the imaging area, where the channel ratio ranges from -4 dB to +4 dB. The two-loudspeaker system has shifted this area to the range of about locations 1.6 to 4, while the matrix system has shifted it much less, to a range of about 2.4 to 5.5.
It can also be seen that the data is not very smooth, despite the averaging of many listeners. There may be several reasons for this. Since humans are making subjective judgements, some variation is expected. Different people may respond differently to phantom images, especially if some have hearing in each side which is not well matched. Another cause, which may be very significant, is that music samples were used to provide an overall indication of imaging performance. Since precise localization, especially of phantom-source locations, is both frequency-dependent and transient-dependent, the mix of music samples could be expected to provide varying results. The intention here was not to separate the various effects of different program material, but instead to indicate the results obtained using typical program material.
The optimum linear-matrix imaging system described here can effectively use more loudspeakers than signal channels to present stereo or multichannel program material with improved imaging performance. An important characteristic is that no dynamic signal modification is needed, and the process is relatively simple and elegant. The provision of an adjustment for the matrix factor allows optimization for imperfect stereo program material or for listener preference. With a good quality signal source, a matrix factor set at 0.5 is effective for accurate imaging.
Using blind testing with eight listeners, this system is experimentally shown to closely match two-loudspeaker imaging performance for centered listeners. It is also shown to create much less stereo-image distortion than a conventional two-loudspeaker stereo system for off-center listeners. Furthermore, the stereo-image focus quality is shown to be consistently improved across the sound stage when using the optimum matrix system. Realistic imaging can be heard off center, allowing coverage of a large audience or listening area with convincing stereo sound.
Figures
Fig. 1 Optimum linear matrix block diagram. [text ref]
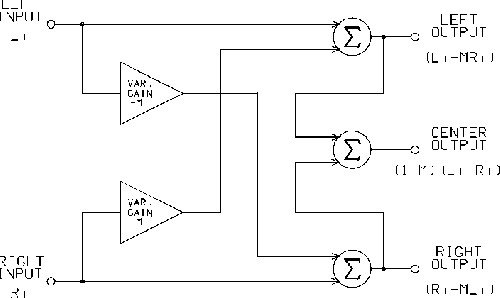
Fig. 2 Vector-imaging concept with three loudspeakers. [text ref]
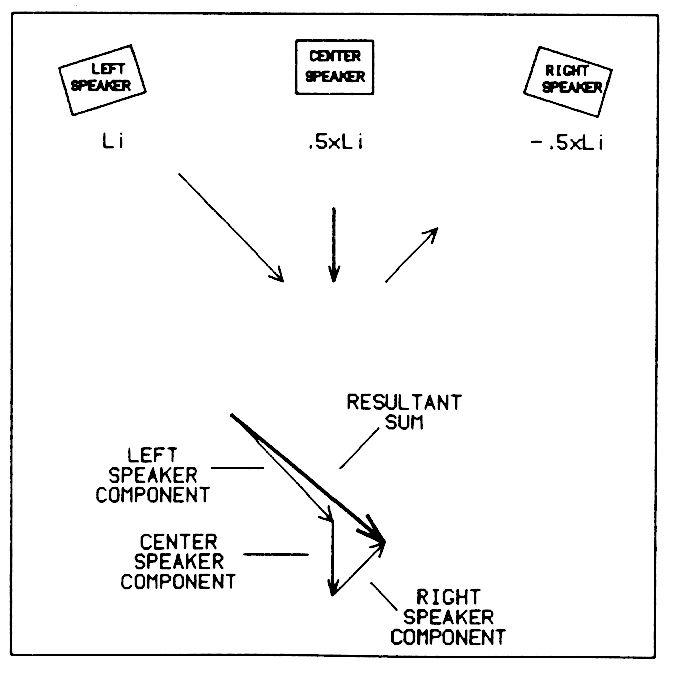
Fig. 3 Dual optimum matrix system with three program channels and five loudspeakers. [text ref]
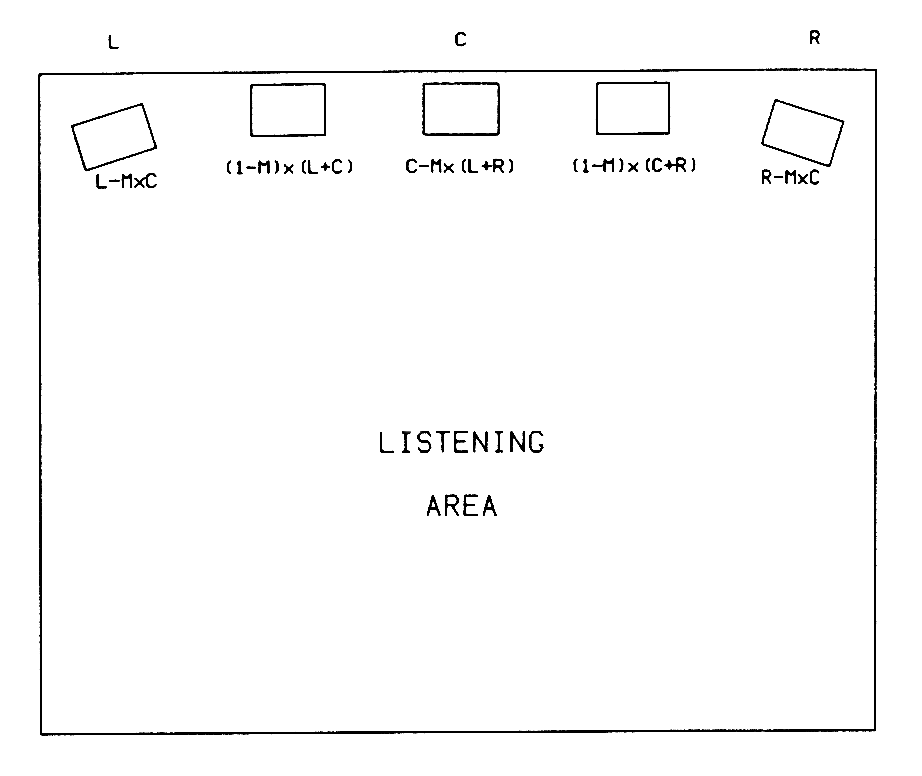
Fig. 4 Multiple optimum matrix system with four program channels and eight loudspeakers. [text ref]
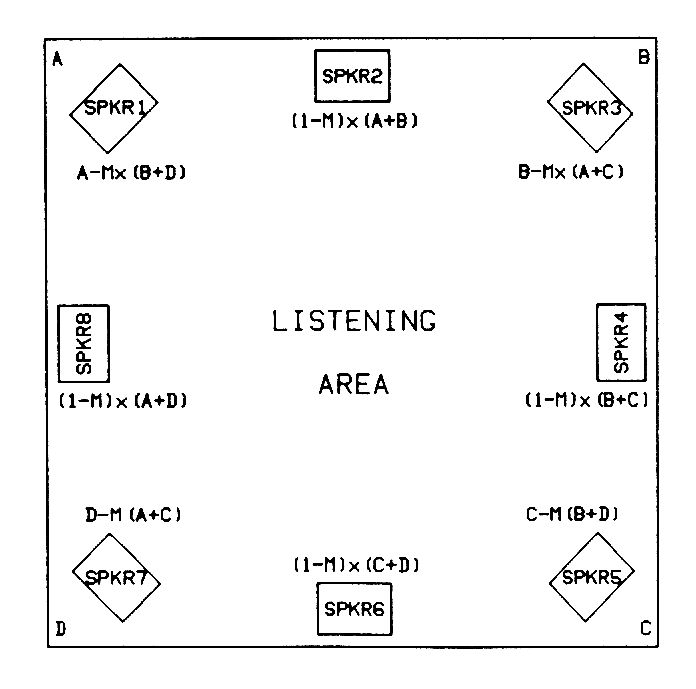
Fig. 5 Multiple optimum matrix system with four program channels and nine loudspeakers. [text ref]
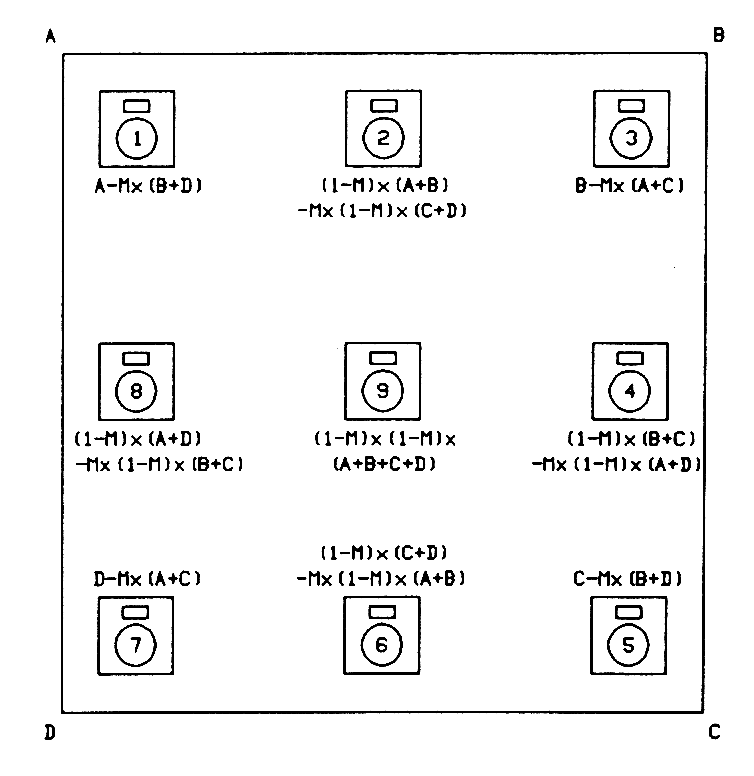
Fig. 6 Room layout for listening experiment. [text ref]
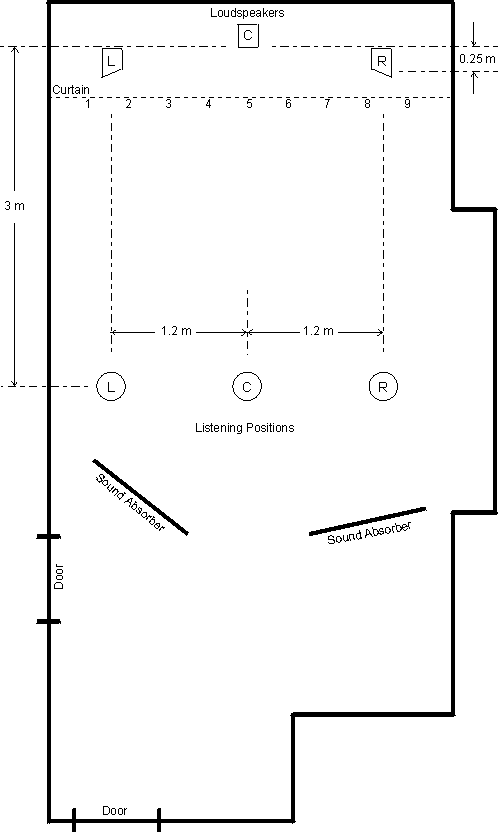
Fig. 7 Perceived sound-source location as a function of relative channel level for centered listeners using two-loudspeaker stereo. [text ref]
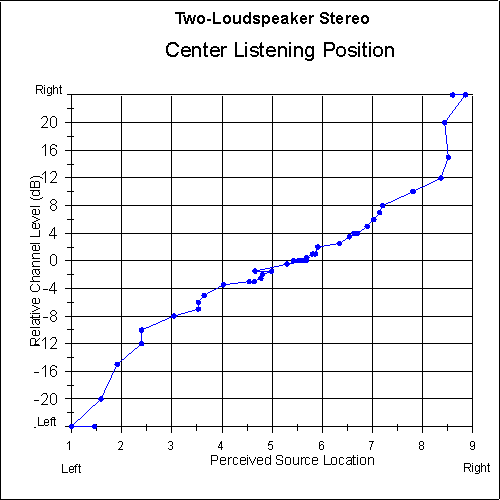
Fig. 8 Perceived sound-source location as a function of relative channel level for centered listeners using three-loudspeaker matrix stereo. [text ref]
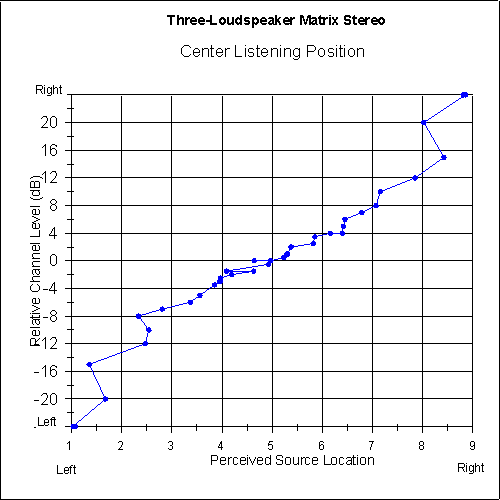
Fig. 9 Relative focus quality as a function of perceived sound-source location for centered listeners using two-loudspeaker stereo. Five-point moving average is applied. [text ref]
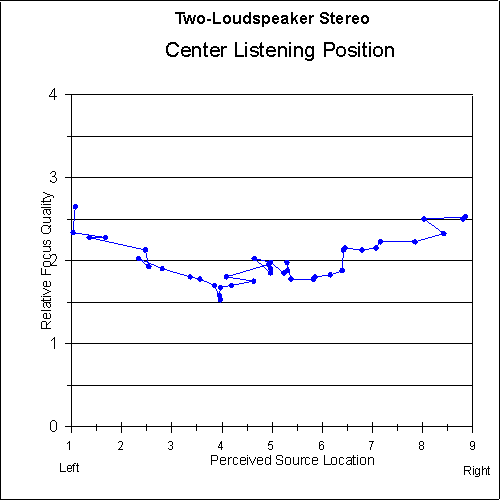
Fig. 10 Relative focus quality as a function of perceived sound-source location for centered listeners using three-loudspeaker matrix stereo. Five-point moving average is applied. [text ref]
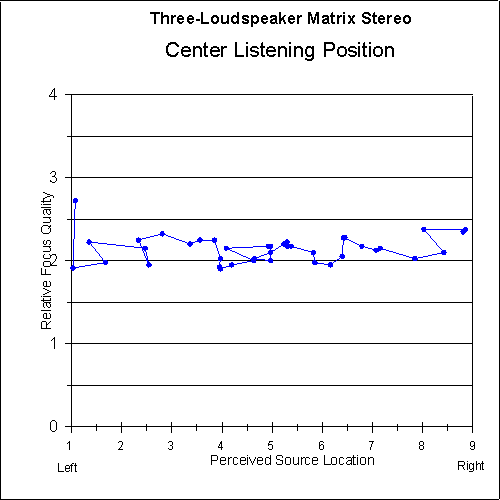
Fig. 11 Perceived sound-source location as a function of relative channel level for left-side listeners using two-loudspeaker stereo. Left-side data is averaged with mirrored right-side data.
[text ref]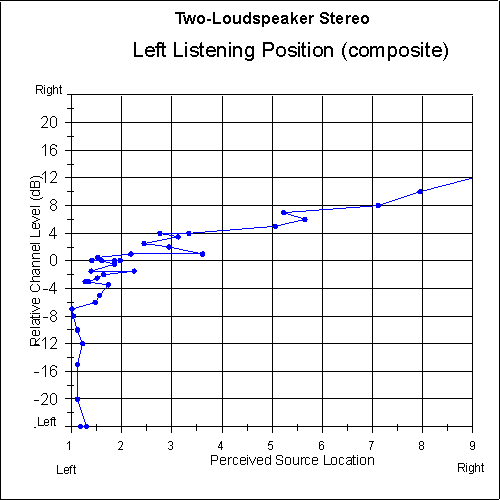
Fig. 12 Perceived sound-source location as a function of relative channel level for left-side listeners using three-loudspeaker matrix stereo. Left-side data is averaged with mirrored right-side data. [text ref]
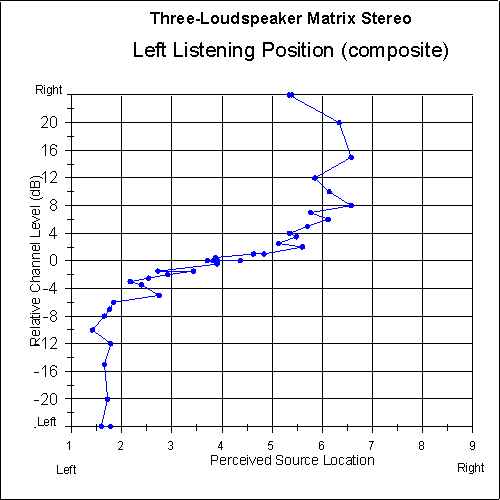
Fig. 13 Relative focus quality as a function of perceived sound-source location for left-side listeners using two-loudspeaker stereo. Left-side data is averaged with mirrored right-side data. Five-point moving average is applied.
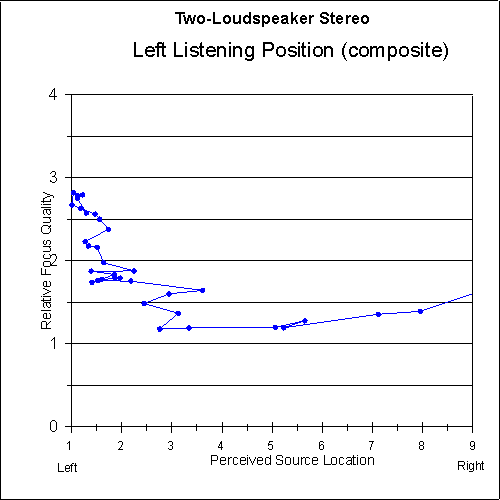
Fig. 14 Relative focus quality as a function of perceived sound-source location for left-side listeners using three-loudspeaker matrix stereo. Left-side data is averaged with mirrored right-side data. Five-point moving average is applied.
